
The gender pay gap is one of the most important policy issues related to compensation.
For the uninitiated, the gender pay gap refers to women systematically earning less than men. The issue is not only a problem of pay discrimination (employers paying women less money than men for the same job), but a host of other differences between men and women in the labor force. For example, women are less likely to advance into leadership positions, and majority-female occupations tend to pay less than comparable occupations that are majority-male.
The data visualization below presents four aspects of the labor market over the past 10 years, split by gender.
The Gender Pay Gap Over Time
The first panel shows the controlled and uncontrolled gender pay gaps over time using data from PayScale’s Salary Survey. (If you want a broad overview of what the gender pay gap is, and why the controlled gap and uncontrolled gaps vary, check out our report, Inside the Gender Pay Gap.)
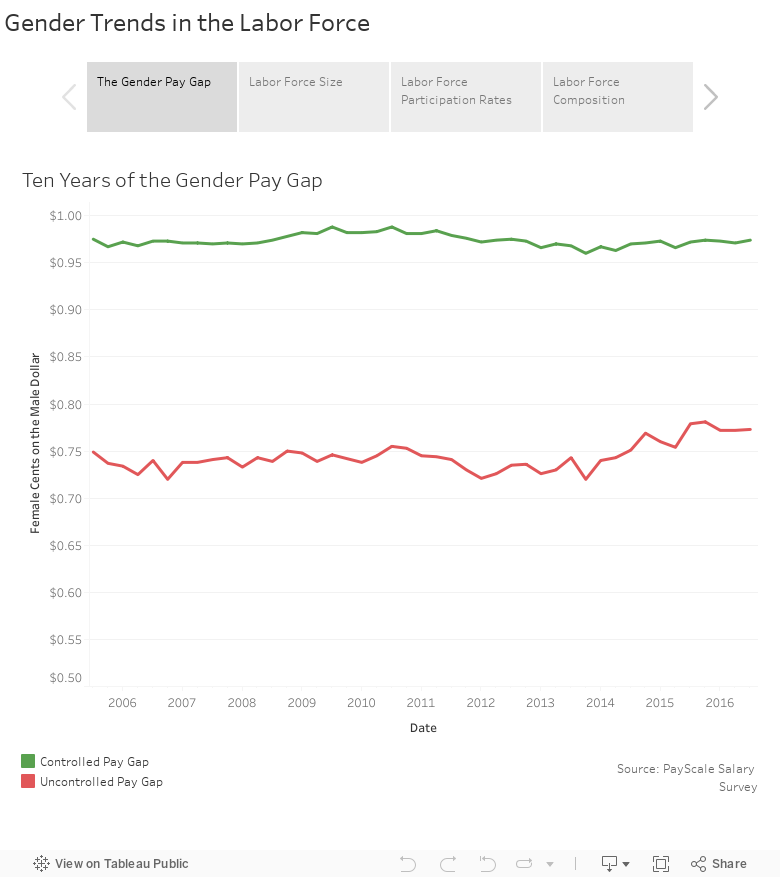
There has been some narrowing recently in the uncontrolled gender pay gap — though not much. In the past year, it increased from the typical woman earning $0.75 to the typical man’s dollar to the $0.77-0.78 range.
There has been even less movement in the controlled pay gap. It gets very narrow at the end of the recession in 2010-2011, but it looks like it has recently returned to pre-recession levels. Women still tend to earn a few cents less on the dollar, even when we consider the various other factors that lead to pay differentials.
Labor Market Trends
The other labor market trends we analyzed here tend to change slowly. First, the labor force is growing for both men and women after taking a significant hit in the Great Recession. Each group surpassed their pre-recession high in 2015.
Second, labor force participation rates may be leveling off after a long period of decline. This statistic is the percentage of the population who are either working or looking for work. Economists debate whether this is a bad omen or simply reflects changing demographics. The decline was about one percentage point stronger for men than for women.
The gender makeup of the labor force has been fairly steady at around 56 percent men and 44 percent women for the past decade. The Great Recession saw women’s share of the workforce hit 45 percent, but it didn’t stay there. A recent study from Pew Research suggests that we may never see equal representation in the workforce.
How We Calculate the Gender Pay Gap
There are two essential ingredients in calculating the gender pay gap. The first is the salary data we collect on PayScale.com. Employees share their salary information in exchange for a report that shows them how their pay compares to similarly qualified workers in their region. The uncontrolled gap comes from comparing median female pay to median male pay from that survey data.
The controlled gap leverages our compensation model, which structures our data and allows us to predict how much someone should be paid, based on their job title, location, skills, etc. The model does not account for gender, so we compare how well the predictions do for men vs. women. What we find is that men tend to be paid slightly above and women slightly below the model predictions. The disparity in those predictions is what we use to calculate the controlled gender pay gap.
Tell Us What You Think
Have you seen evidence of the gender pay gap in your career? We want to hear from you. Tell us your thoughts in the comments or join the conversation on Twitter.
This gender pay gap is really annoying and rather a decrement, an aggravated surge of the decrease of payment when it goes down the females has been noted at large… Hope, it is really abolished soon…
Google Contact Number
wow, great information and superb post I appreciate your work.