Even with the uncertainty brought about by the federal government’s budgetary issues, Q4 2012 proved to be yet another strong quarter for wage growth. Wages for most cities, industries, job categories and company sizes tracked by The PayScale Index are the highest they’ve been since 2006 and every measure of The PayScale Index experienced an annual growth in wages.
“While the headlines oftentimes go to the large-sized companies, The PayScale Index for the second consecutive quarter showed wage growth for small companies outpacing medium and large companies,” said Katie Bardaro, lead economist, PayScale. “Wages in Q4 2012 grew by 2.2 percent for small companies compared to only 1 percent for medium companies and 0.9 percent for large companies. This strong quarterly growth pushed small companies to almost 5 percent year-over-year wage growth, compared to only 2.7 percent for medium companies and 3.3 percent for large companies.”
Q4 2012 PayScale Index highlights include:
Media & Publishing Jobs overthrew IT Jobs as the job category with the largest annual growth in wages in Q4 2012.

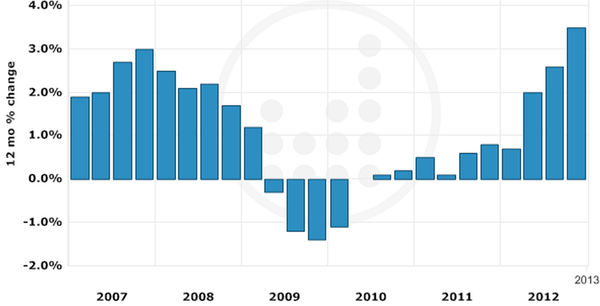
- With a quarterly wage increase of 2.2 percent in Q4, on top of quarterly wage increases of 1.4 percent in the preceding two quarters, Media & Publishing Jobs experienced annual wage increases of 4.6 percent in Q4 2012, just beating out IT Jobs at 4.4 percent.
- After a bumpy ride from 2008 to 2011 that resulted in little to no growth, this job category has been on fire in 2012.
Another winner this quarter is Construction Jobs – not only is new home construction the highest it has been in more than four years, but wage growth is the best it’s been in more than three years:
- Annual wage growth for Construction Jobs was tied for third across all job categories for Q4 at 4.2 percent.
- The Construction Industry didn’t perform quite as well relative to other industries, but finally reached wage growth levels higher than its previous peak in Q4 2008. And from Q1 2011 to Q4 2012, wages grew by more than 4 percent.
It was a big quarter for Food Service workers as wages in both the job category and industry finally rose above their 2008 peak levels.
- Food Service and Restaurant Jobs have consistently shown little to no wage growth after a steep drop in late 2008. However, 2012 was a good year for this job category as wages grew each quarter until they finally surpassed their previous peak levels in Q4.
- Annual wage growth for Food Service and Restaurant Jobs was 3.3 percent in Q4 and annual wage growth for the Food Services and Accommodation Industry was 3 percent – the highest either have been since being tracked by The PayScale Index.
Adds Bardaro: “There is still no stopping the pay increases for jobs related to energy or technology, particularly highly skilled ones, as they experienced annual wage growth north of 3 percent and, in some cases, north of 5 percent.”
About The PayScale Index
The PayScale Index follows changes in total cash compensation for full-time, private industry employees in the United States and Canada. In addition to a US national index and a Canadian national index, it includes separate indices for the following:
- 15 private industries in the U.S. as defined by the North American Industry Classification System (NAICS)
- 20 largest U.S. metropolitan areas, as defined by the Office of Management and Budget (based on the July 1, 2009 population estimates by the United States Census Bureau).
- Three company sizes in the U.S.: small (under 100 employees), medium (between 100 and 1,500 employees) and large (greater than 1,500 employees).
- 19 U.S. job categories, as defined, in part, by the Standard Occupational Classification (SOC) system.
- Six largest Canadian metropolitan areas, as defined by the Standard Geographical Classification (based on the July 1, 2010 population estimates by the Canadian Census).
The PayScale Index utilizes a unique approach to trend measurement. Unlike indices such as the Consumer Price Index, which measures the prices of certain goods and services (periodically updated to reflect changes in buying habits of Americans), The PayScale Index uses data on all private-sector, full-time employees working in a given time period.
PayScale has performed a detailed analysis of how various compensable factors, like work experience, education, employment setting and job responsibilities affect pay. This analysis is based on PayScale’s extensive data of more than 40 million employee profiles, accounting for 250 compensable factors for more than 12,000 unique job titles, which show how the pay of actual workers varies with each of these factors.
More than 2,300 organizations use PayScale’s subscription software to:
- Allocate raises. PayScale Insight allows you to allocate raises based on employee performance and labor budget.
- Attract talent. Price jobs based on your local market and competition.
- Retain employees. Get pay right and show them how you did it. Your employees will be more satisfied to stay.
- Drive performance. Get their salary right so they can focus on doing a good job.
- Be confident. With know-how to talk about comp with anyone.
What are you waiting for?

Leave a Reply